Biking vs. Driving Commute Analysis
Back in 2019 when we were all still in the office, I used to swap between driving to work and biking to work depending on the day. I decided to gather data on my commute for the year and use it as a fun dataset to practice data visualization, analysis reproducability, and data gathering. And, this is real-world data, not a nice clean dataset handed to you that is easy to work with, so it was good practice for data wrangling as well.
Tracking
Biking
To track my bike commutes I used strava. They have a good API through which you can access your data, and someone even wrote stravalib, a Python library that wraps their API and makes it even easier. Great! I did have to do some extra wrangling here because I also track non-commutes on Strava, but it’s easy enough to make bounds on start/end location and time of day to filter down to my commutes.
Driving
I went super hi-tech here - I started a stopwatch on my phone before I left, and I stopped it when I got to my location. This did mean I had hundreds of pictures of timers to go through and do data entry for - I ended up having fun with an OCR library, Pytesseract, to automate reading the timer instead of having to type them in myself. And I could use the metadata on the image to get the time the screenshot itself was taken, so I dodged all the manual data entry.
Analysis
| Bike or Drive | Time of Day | Number of Times |
|---|---|---|
| Bike | Morning | 52 |
| Bike | Evening | 45 |
| Drive | Morning | 111 |
| Drive | Evening | 93 |
I’m much more likely to run errands on the way home from work, so I would filter those out of my analysis (that’s why there’s less data for the evenings).
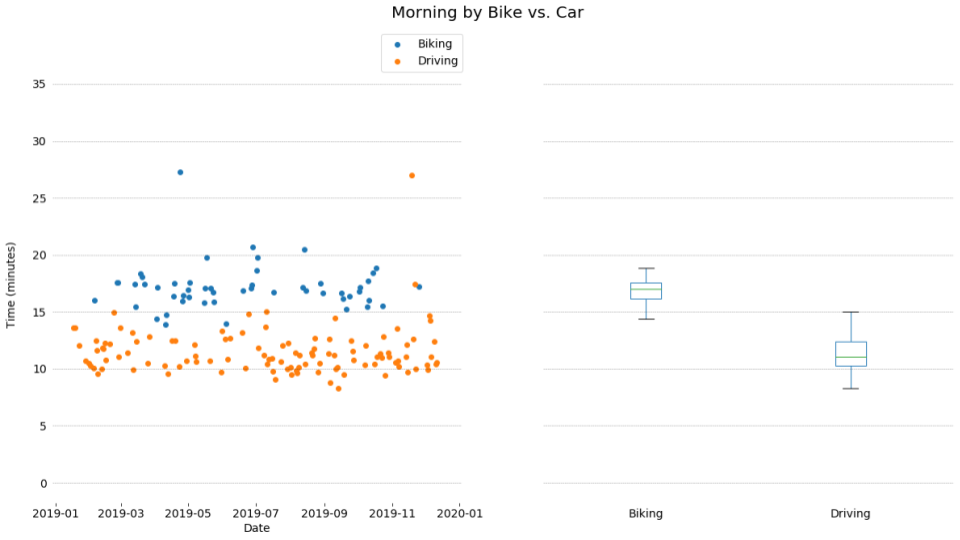
My driving commute was only 1.7 miles which was great, but it was through a traffic-heavy part of Atlanta. In no traffic Google Maps would tell me it was about 8 minutes. My biking commute was 2.8 miles - a little out of the way, but my route featured safe and fun separated infrastructure for a portion of the route (including bike lanes and the Beltline). Google estimated this should take about 20 minutes.
Looking in detail at my morning commutes, driving was definitely consistently faster than biking. However, it had notably higher variance. This makes sense because I could get caught in traffic in my car, whereas most of my bike commute was on separated infrastructure. The only outlier you can see on the graph of my bike commutes was when my bike broke in the middle of the ride - I had to walk the rest of the way. Other than that, it was fairly consistent.
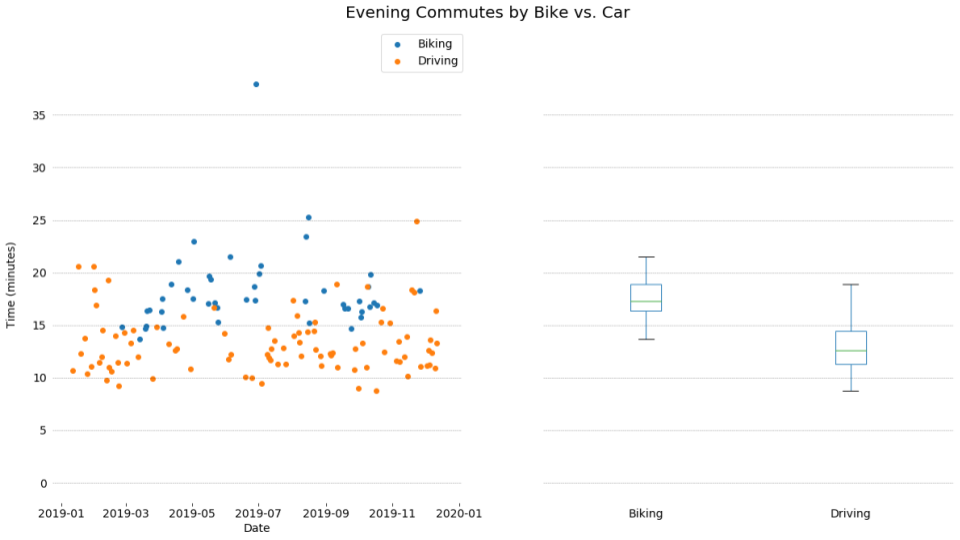
My evening commutes tell a different story - the average time for driving was still faster, but there was significantly more overlap between the upper end of driving and biking. This has an easy explanation - as a software engineer, I worked a later scheduler than most. I often left for work after morning traffic had settled. I did not, on the other hand, stay late enough for Atlanta’s evening rush hour to pass, so it was much more common for me to get caught in traffic on the way home. The biking was also slower for two main reasons: the Beltline is slightly sloped uphill on the way home, and it is more crowded with people in the evening than it is in the morning. Thus, the ride is a little slower physically, and I went slower to be safer on the more crowded Betline. The outlier bike ride up in the 35+ minute range is another instance of a bicycle malfunction.
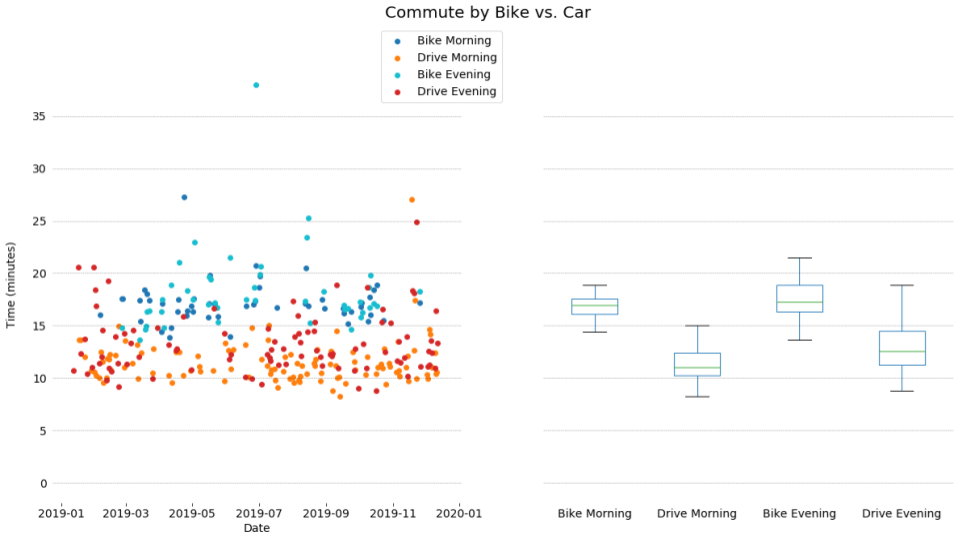
Here’s a graph of the morning and evening commutes combined - the scatter plot is a little messier, but the box-and-whisker plots show an interesting comparison.
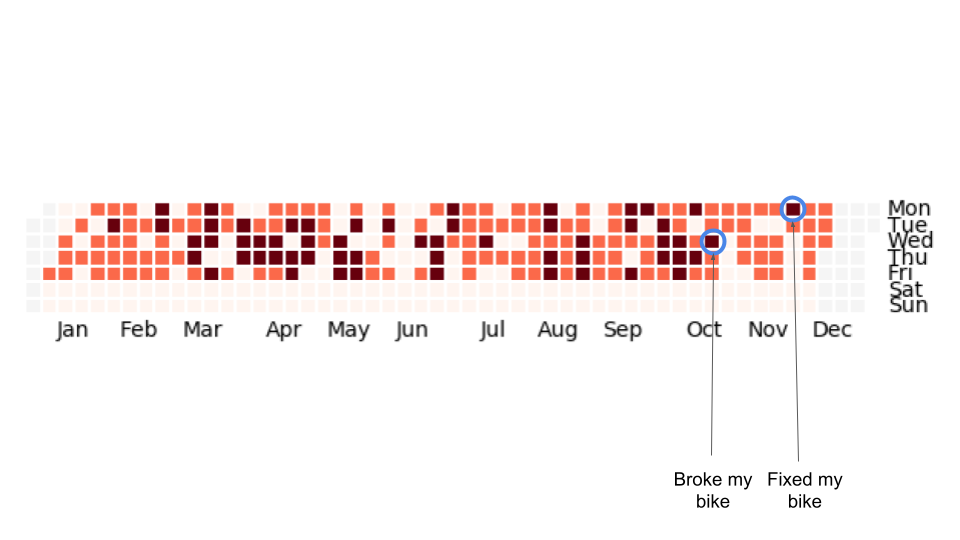
Last, we can take a look at a calendar of all my tracked rides. The paler squares represent a day with a tracked drive, and the darker squares represent a day with a tracked bike.
I find the trends of the year fun to look at. In January I was a newer employee and was not confident coming into work sweaty, and it was cold.
As we got into better weather, I started to get more comfortable biking and did it a decent percentage of the time. I petered off in the hot summer, and if I recall a very rainly July that we had that year. I started biking again more and built the habit until I unfortunately broke my bike in October. That timed up with a busy last quarter of the year for me (which included a move in December), so I didn’t make time to fix the bike and get back into the habit. I also stopped collecting data after my move since it would be very different.
I started tracking this data again in 2020, but due to work-from-home and living safely during the pandemic, my commuting completely stopped. Whenever I get back to the office I plan to continue tracking this kind of data - it turned into a very fun project for me!